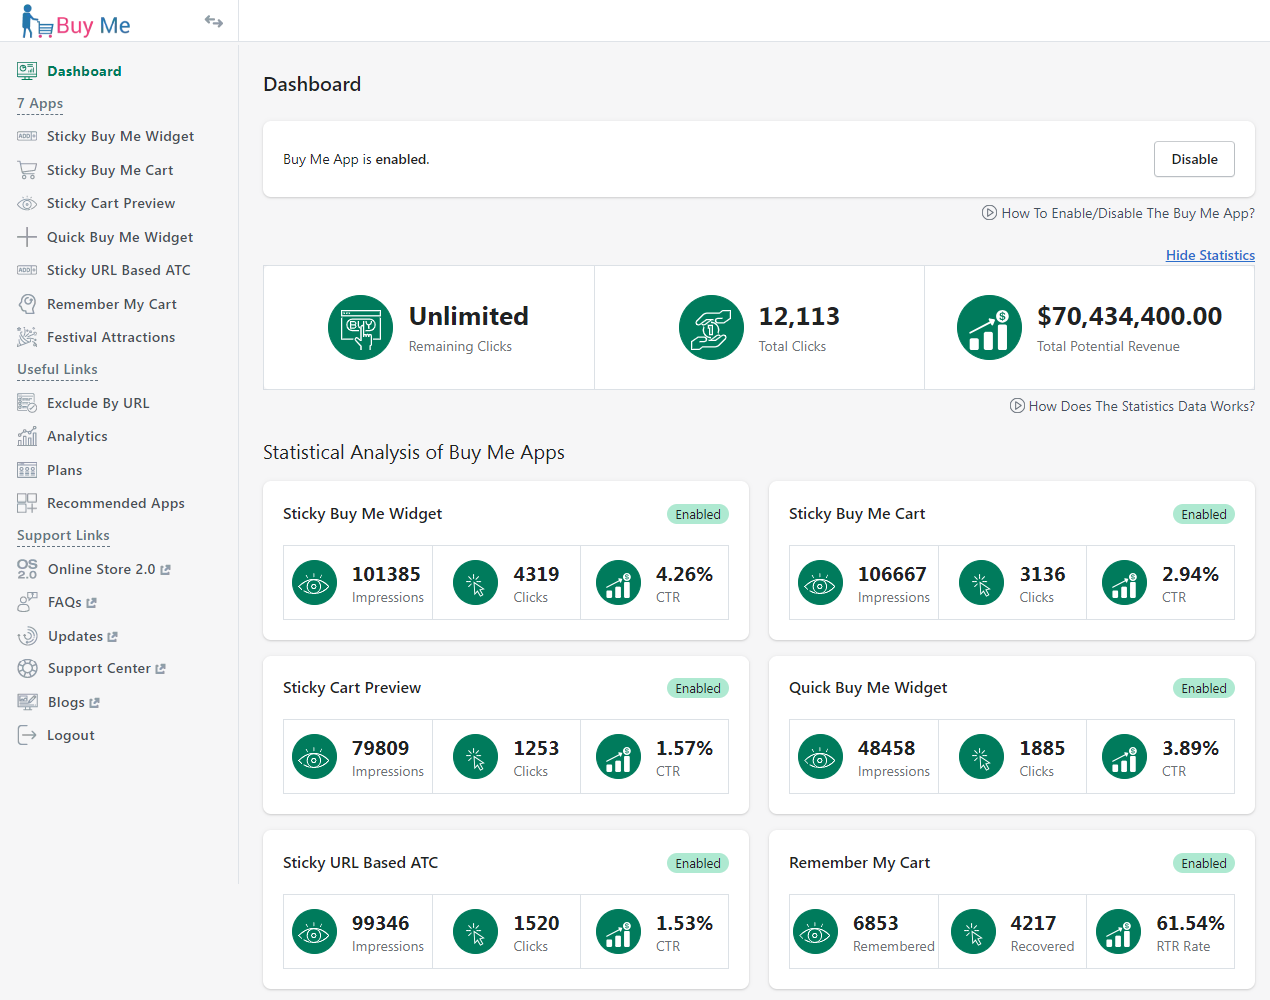
Thank you for joining. And let’s get started with the article. The Buy Me – Buy Button app has a Dashboard. Dashboard — is a glance preview of the most crucial information of the store owners/merchants. The dashboard is an easy way to navigate directly to various areas of the application that require the store owner’s/merchant’s attention. Let’s discuss one by one all the options of Dashboard.
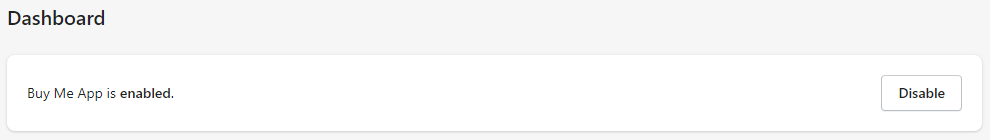
Make sure the Buy Me – Buy Button app status is enabled to use all the apps/features like the Sticky Buy Me Widget, Sticky Buy Me Cart, Sticky Cart Preview, Quick Buy Me Widget, Sticky URL Based ATC, Remember My Cart and Festival Attractions.
1) Statistics:

Here the Statistics of dashboards aim to impart information quickly to store owners/merchants as they are engaged in time-sensitive tasks. The main goals of the Statistics are to present data deviations to the merchants quickly and clearly, show current resources, and display their status.
Here, the Statistics of the Dashboard are for the purpose of information, where you can find the Remaining Clicks, Total Clicks, and Total Potential Revenue.
The first column displays the number of remaining add-to-cart clicks for the current month.
The second column contains the total number of add-to-cart clicks performed by the website/store visitors. Here, the total number of add-to-cart clicks contains the number of add-to-cart clicks since the Buy Me app is installed and not for the current month only. The Buy Me app will count click as 1 click when a visitor clicks on either the add-to-cart button of the Sticky Buy Me Widget or the add-to-cart icon of the Quick Buy Me Widget.
The third column displays the “Total Potential Revenue”. It is the gross income figure. It represents the potential figure, that you may have earned through the Buy Me app. When someone adds a product to the cart through the icon of the Quick Buy Me Widget or Add-To-Cart button of the Sticky Buy Me Widget, the app will add the price of the product to the Total potential revenue.
2) Statistical Analysis of Buy Me Apps

I) Sticky Buy Me Widget
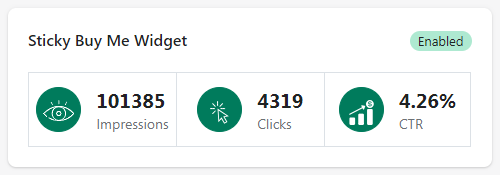
Here, you can see the number of impressions. (When the Sticky Buy Me Widget is displayed for more than two seconds on a page, the app will consider it as 1 impression.)
Clicks represent the number of clicks performed by the customer (visitor) on the Add To Cart button of the Sticky Buy Me Widget.
Next is Click Through Rate (CTR) is the percentage of Clicks versus Impressions. And it is calculated by [CTR = (Number of Clicks * 100) / Impressions].
II) Sticky Buy Me Cart

Here, you can see the number of impressions. (When the Sticky Buy Me Cart is displayed for more than two seconds on a page, the app will consider it as 1 impression.)
Clicks represent the number of clicks performed by the customer (visitor) on the Sticky Buy Me Cart icon.
Next is Click Through Rate (CTR) is the percentage of Clicks versus Impressions. And it is calculated by [CTR = (Number of Clicks * 100) / Impressions].
III) Sticky Cart Preview
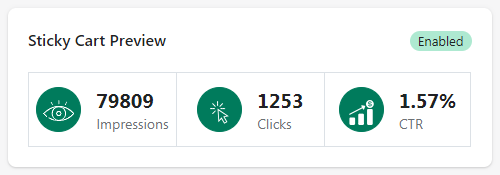
Here, you can see the number of impressions. (When the Sticky Cart Preview is displayed for more than two seconds on a page, the app will consider it as 1 impression.)
Clicks represent the number of clicks performed by the customer (visitor) on the Sticky Cart Preview.
Next is Click Through Rate (CTR) is the percentage of Clicks versus Impressions. And it is calculated by [CTR = (Number of Clicks * 100) / Impressions].
IV) Quick Buy Me Widget
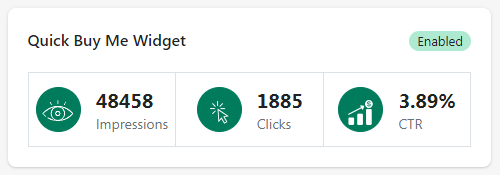
Here, you can see the number of impressions. (When the Quick Buy Me Widget is displayed for more than two seconds on a page, the app will consider it as 1 impression.)
Clicks represent the number of clicks performed by the customer (visitor) on the icons of the Quick Buy Me Widget.
Next is Click Through Rate (CTR) is the percentage of Clicks versus Impressions. And it is calculated by [CTR = (Number of Clicks * 100) / Impressions].
V) Sticky URL Based ATC
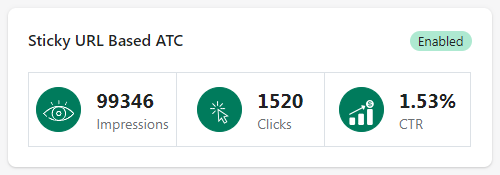
Here, you can see the number of impressions. (When the Sticky Buy Me Widget is displayed on other than the product page using the Sticky URL Based ATC for more than two seconds on a page, the app will consider it as 1 impression.)
Clicks represent the number of clicks performed by the customer (visitor) on the Add To Cart button of the Sticky Buy Me Widget displayed on other than the product page using the Sticky URL Based ATC.
Next is Click Through Rate (CTR) is the percentage of Clicks versus Impressions. And it is calculated by [CTR = (Number of Clicks * 100) / Impressions].
VI) Remember My Cart

Here, you can see the Remembered. (When the customer (visitor) adds the products to the cart after logging in, the app will consider it as 1 Remembered event.)
Same way, you can see the Recovered. (When the customer (visitor) recovers added-to-cart products by logging in, the app will consider it as 1 Recovered event.)
Next is Remembered To Recovered (RTR) is the percentage of Recovered versus Remembered. And it is calculated by [RTR = (Recovered * 100) / Remembered].